ATT&CK Coverage Maps · Tidal Cyber · Confidential
Turning a wall of data into a clear answer.
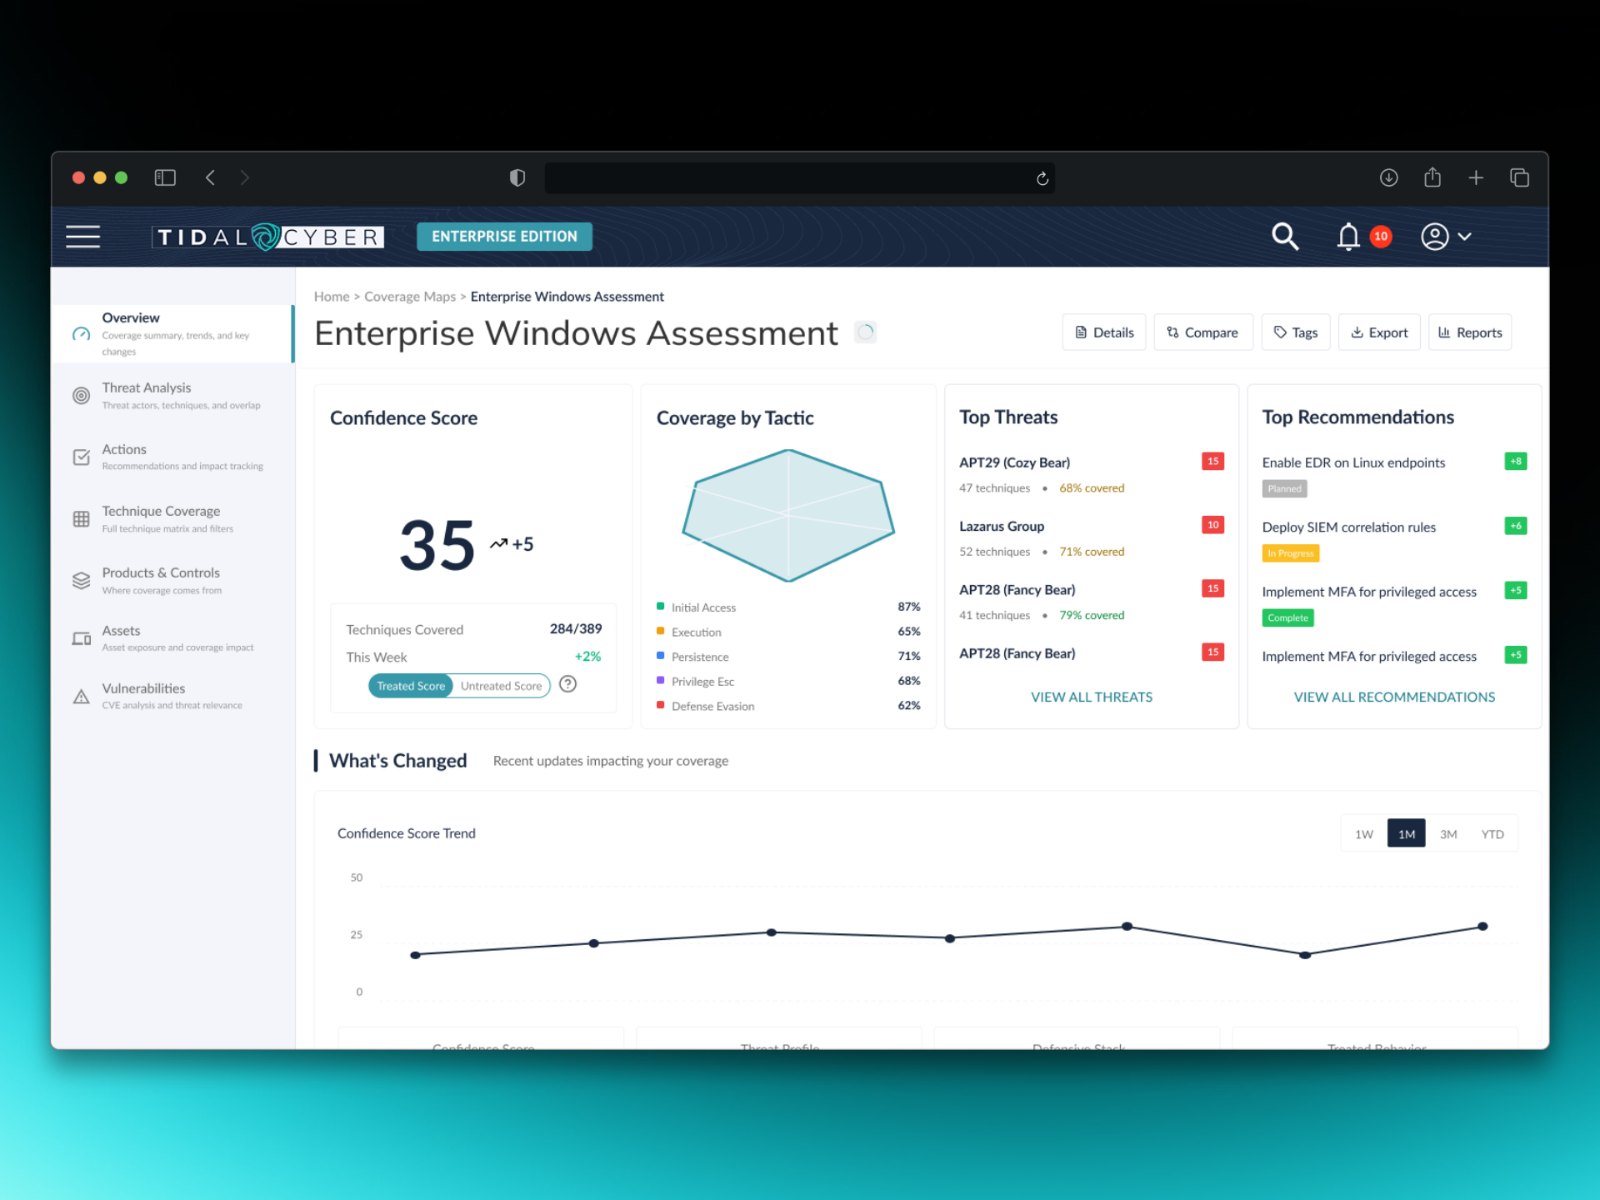
Tidal Cyber's coverage map shows how well a company's security tools hold up against known attacker behavior. The answers were all there, buried in a dense grid that executives and analysts both struggled to read. I led the UX end to end to give each audience the answer it came for.
2 Fortune 500s
Security teams at two Fortune 500 institutions validated the direction before development started.
2 audiences, 1 map
Executives get a quick, defensible answer. Analysts get the detail, one step away.
All customers
Shipped to the full customer base, not a pilot group.
01 · The problem
Lots of data, no hierarchy.
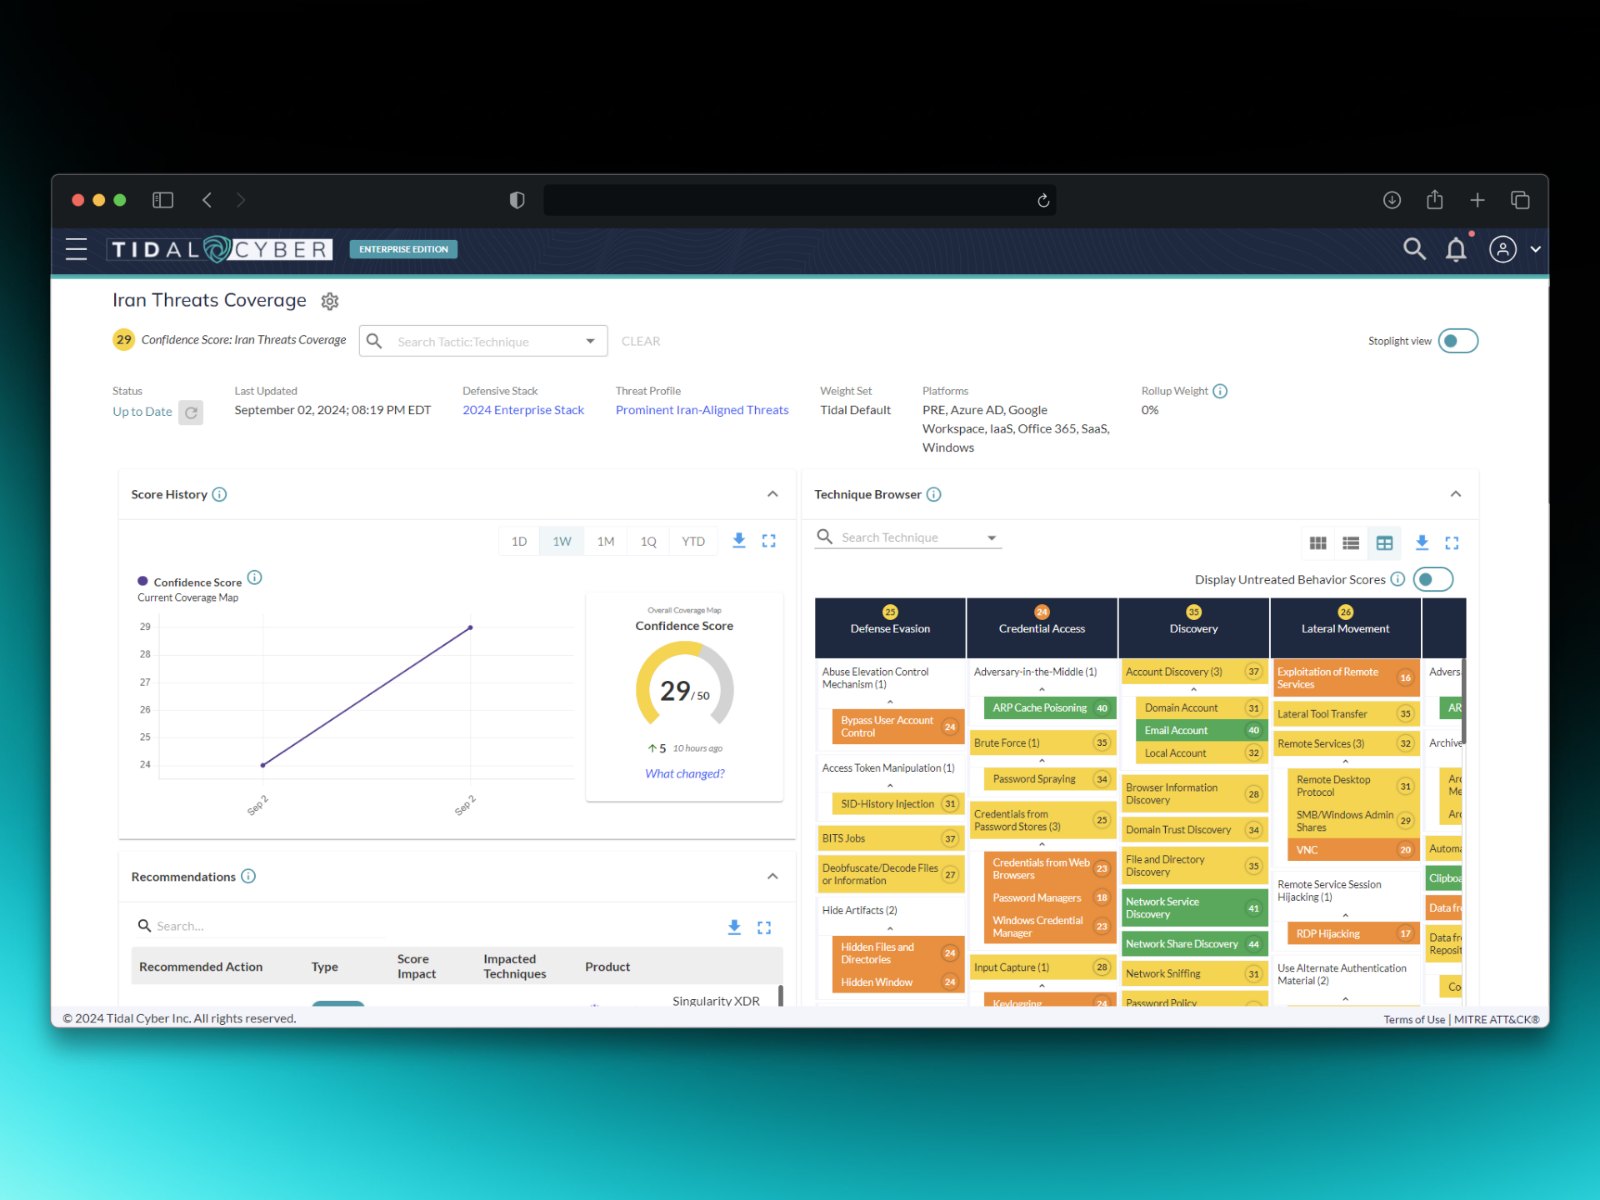
The map is built on MITRE ATT&CK, the industry's standard catalog of attacker behavior: hundreds of attack techniques, grouped by the attacker's goal. The old view showed all of them at once. Everything looked equally important, so nothing stood out. Teams could see the data existed, but not what it meant for their risk.
Two very different audiences shared that one screen. Executives needed a quick, defensible answer to "how covered are we?" Analysts needed to dig into specific techniques, tools, and gaps. The old view served neither well.
The question wasn't how to show more data. It was how to show the right data to the right person at the right depth.
02 · How I approached it
Start with what people actually ask.
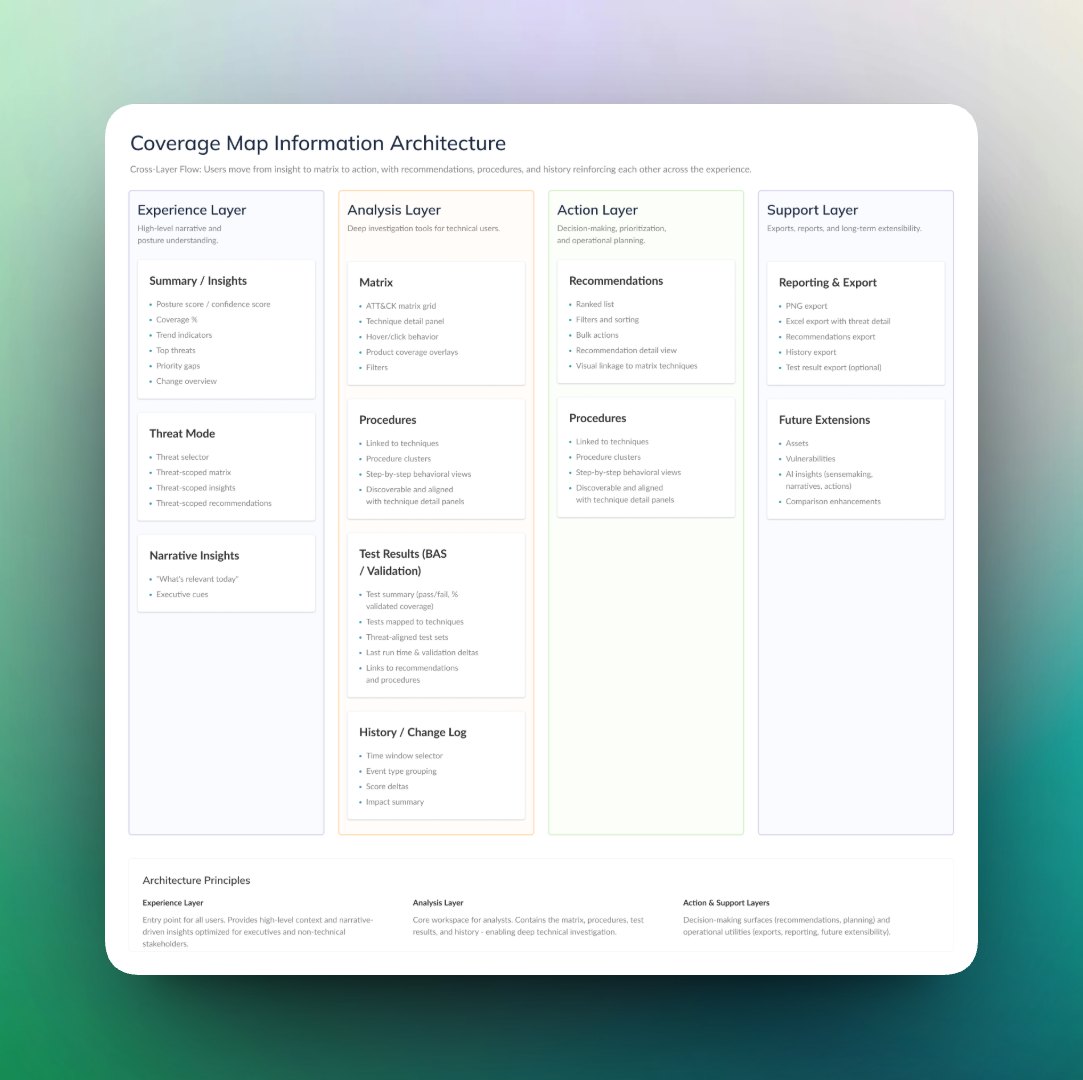
I started with our sales team, who hear customers' questions every day, and turned those questions into a map of what executives and analysts each need. That gave us a clear picture of what each audience came to the map to learn.
From there I structured the experience around progressive disclosure: a summary for the quick answer, with detail one step away for anyone who needs it. I worked with engineering early to check how coverage scores are calculated, so the design never promised something the data couldn't back up. Before development started, I validated the direction with security teams at two Fortune 500 institutions.
03 · Key decisions
Four decisions that shaped the map.
Hierarchy
Answer the big question first.
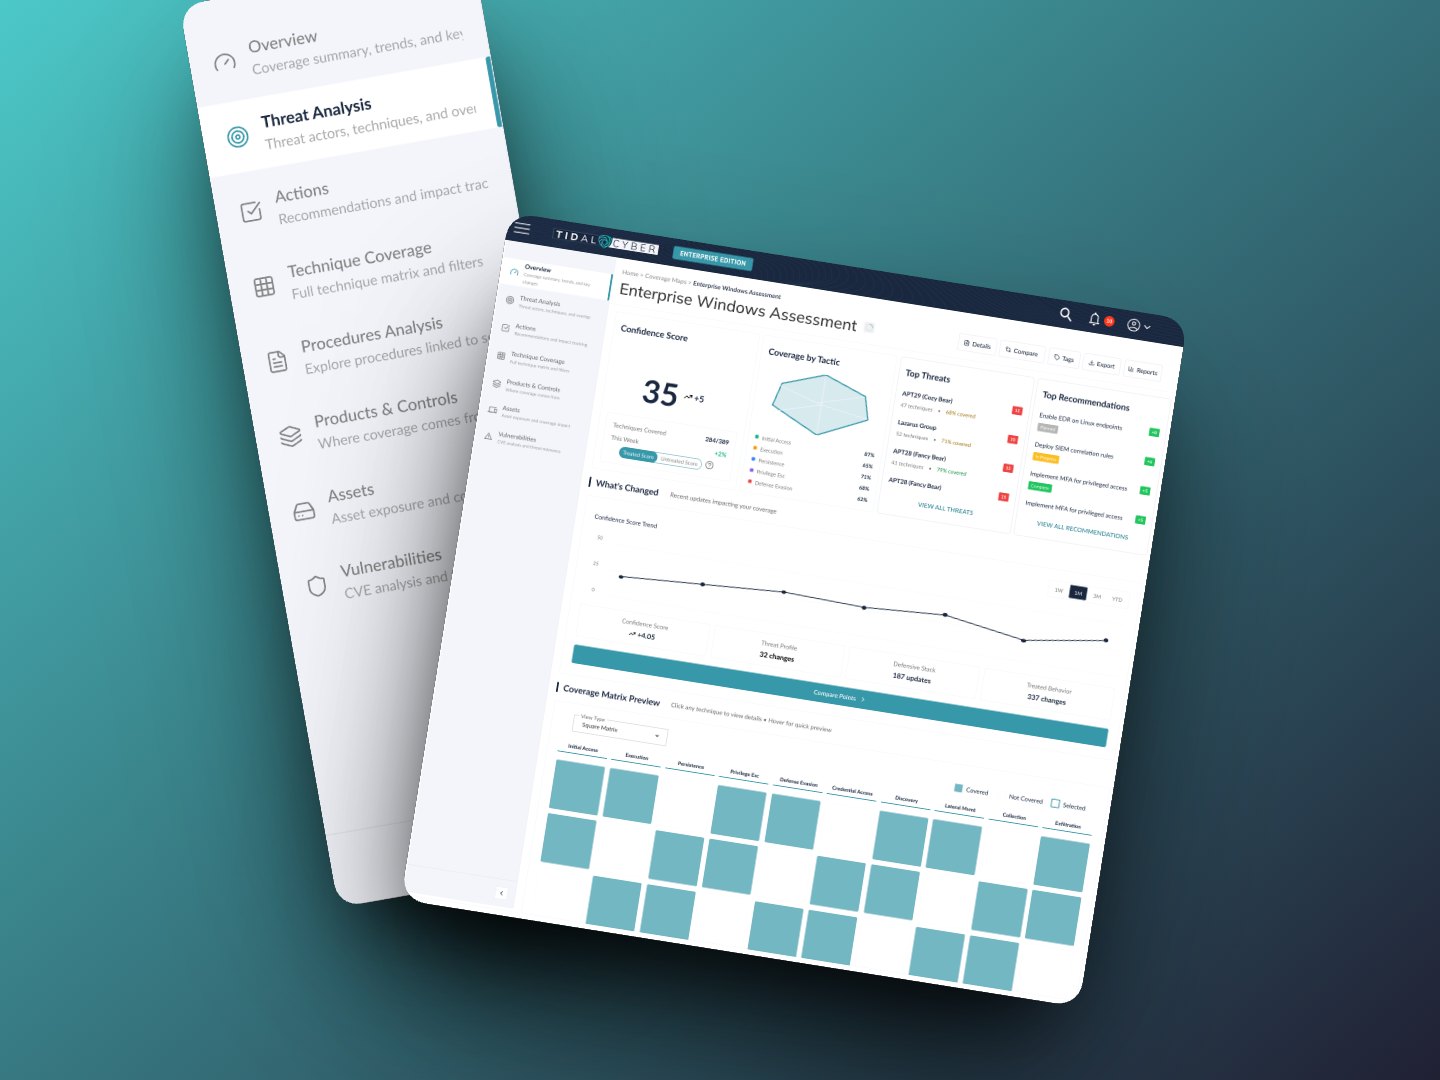
The first screen answers "how covered are we?" Step-by-step attack detail moved one layer down, where analysts can reach it without crowding the summary executives rely on.
Honesty
Only show visualizations the data can support.
Where the data couldn't honestly support a chart, we didn't show one. In a security product, a confident-looking visual built on thin data is worse than no visual at all.
Reporting
Make the numbers travel.
Coverage rolls up from individual techniques to attacker goals to one overall view, so the same numbers carry into the reports teams share with leadership. Nobody has to rebuild them in a spreadsheet.
Overlap
Show overlap at a glance.
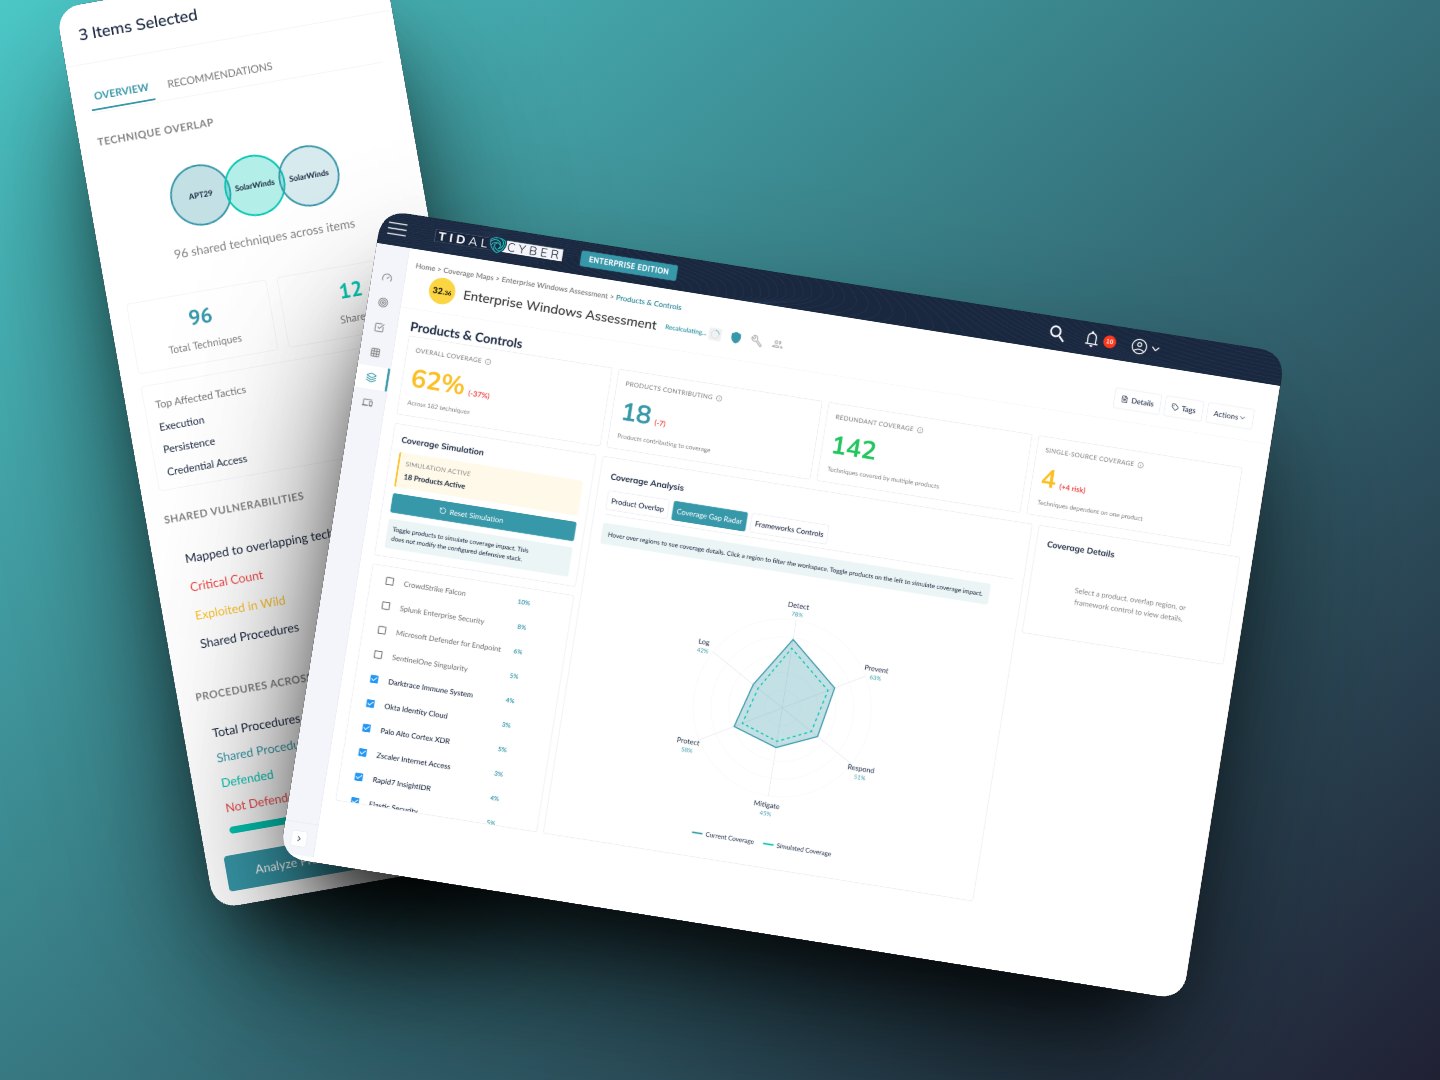
Teams wanted to know where their security tools overlap and where they leave gaps. Overlapping-circle (Euler) diagrams made that visible at a glance, and filtering by threat let teams focus on the threats that matter most to them.
04 · The second cycle
Filtering added a new layer to solve.
Adding global filtering brought a new layer of complexity. Once teams could narrow the map, we had to go back to the data to work out how best to display the filtered results. I led that second design cycle as a refinement of the first, not a restart.
05 · What I took from this
Lessons that carry beyond security.
Validate the data before you design the chart.
Checking how scores were calculated early kept us from shipping visuals that looked authoritative but couldn't be trusted. That holds for any dashboard people make decisions from.
One surface can serve two audiences.
Progressive disclosure let executives and analysts use the same map without either one fighting the other's needs.
Start with the people who hear the questions, then go to customers.
The sales team already knew what customers asked. Starting there got us to the real needs faster, and validating with customers before development confirmed we had them right.
06 · What I'd do differently
I'd lock down the scoring and rollup rules with engineering before designing any visuals. We checked how scores were calculated early, but agreeing on every rule up front would have let the visual design move faster, with fewer open questions along the way.