Electronics & Accessories · Dell Technologies · E-commerce A/B test
Testing a redesign instead of guessing at one.
Dell's Electronics & Accessories page got a lot of traffic, but shoppers had to dig through sales banners and long product rows to find what they came for. Instead of redesigning on instinct, I set it up as an A/B test, with success defined before any design work, and tested two new layouts against the original.
68.9% to 72.8%
Share of shoppers who engaged with the category tiles, original page versus Recipe B.
6.95% to 7.26%
Effective conversion: the share of all shoppers who engaged with a tile and went on to convert.
2 of 2 variations
Both redesigns beat the original on engagement and effective conversion.
01 · The problem
High traffic, and no clear theory for why it wasn't working harder.
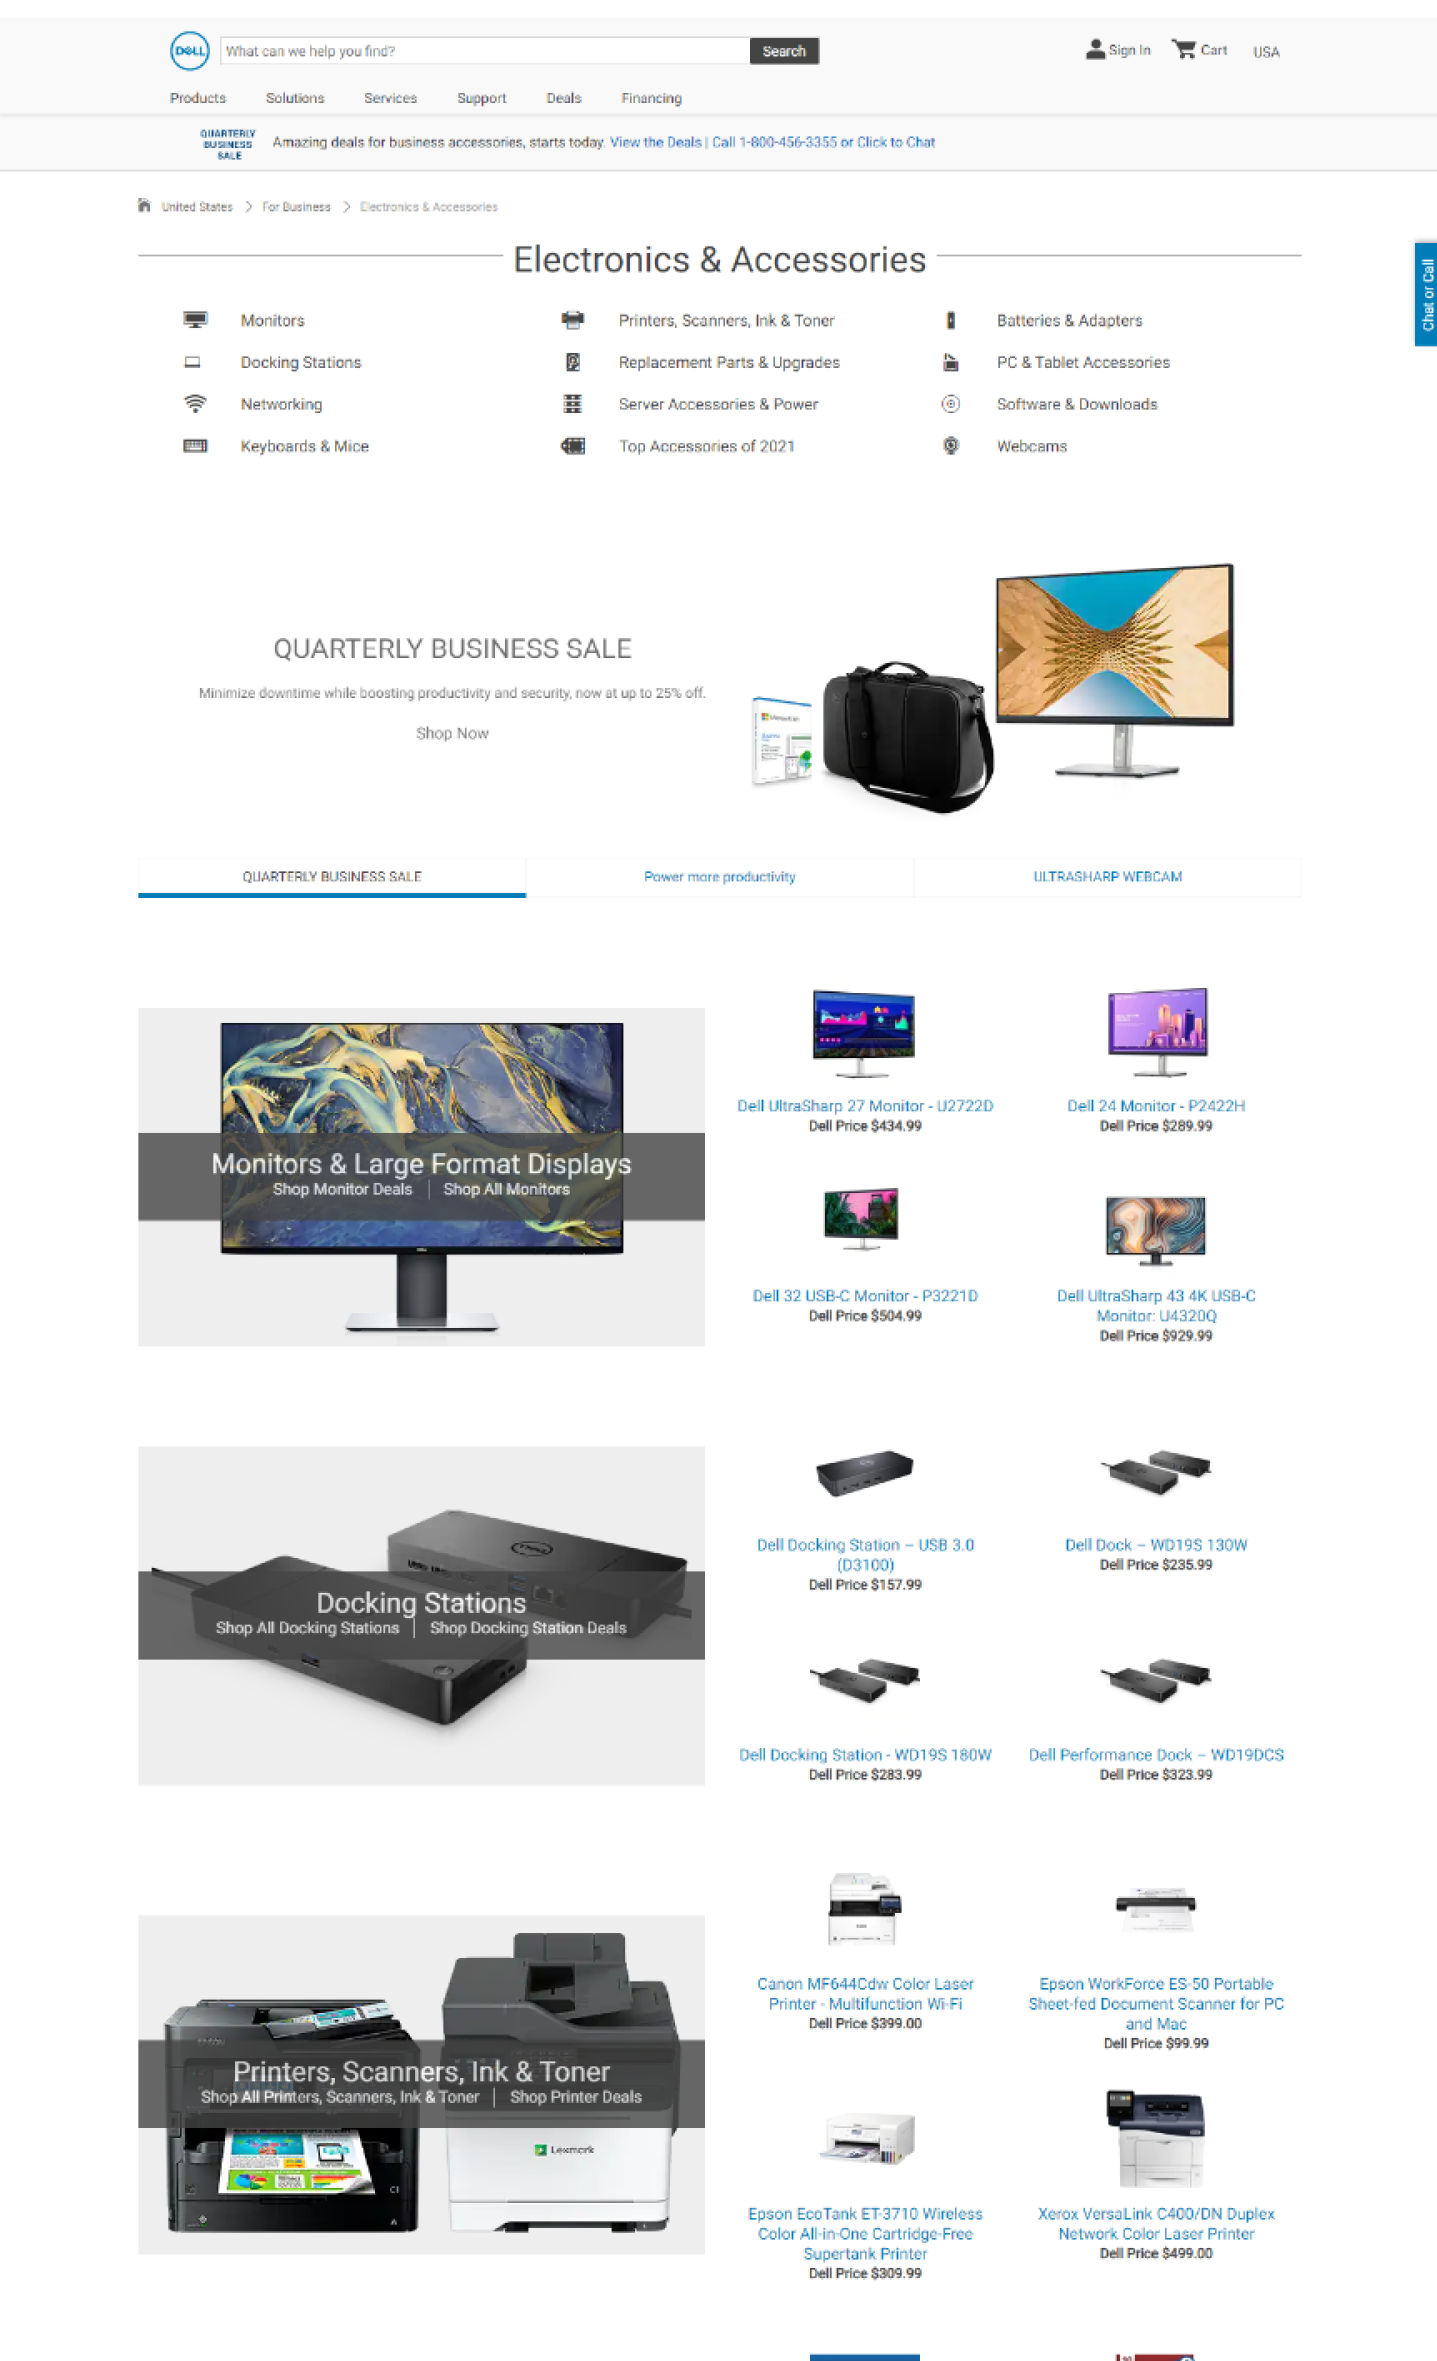
The page had collected years of design decisions without a clear strategy. It opened with a text list of categories, then a sale banner, then long rows of individual products. Shoppers who came for one kind of accessory had to scroll and scan to find it.
Nobody had a confident answer for what was wrong. Redesigning without a test would have replaced one set of guesses with another.
If you pick your success metrics after the redesign, you'll pick the ones that make it look good.
So before any design work, I defined what "better" would mean and how we'd measure it. The test would either support the idea or it wouldn't, and we'd learn something either way.
02 · The approach
Audit the page, turn problems into hypotheses, design to test them.
I reviewed the original page against those measures and noted where it was likely slowing people down. The biggest issue was that the page led with promotions and individual products instead of helping people find the right category first.
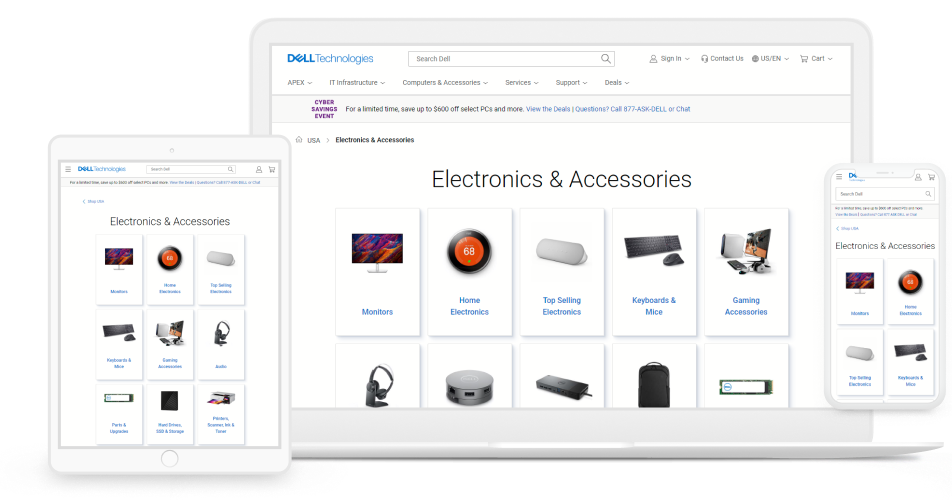
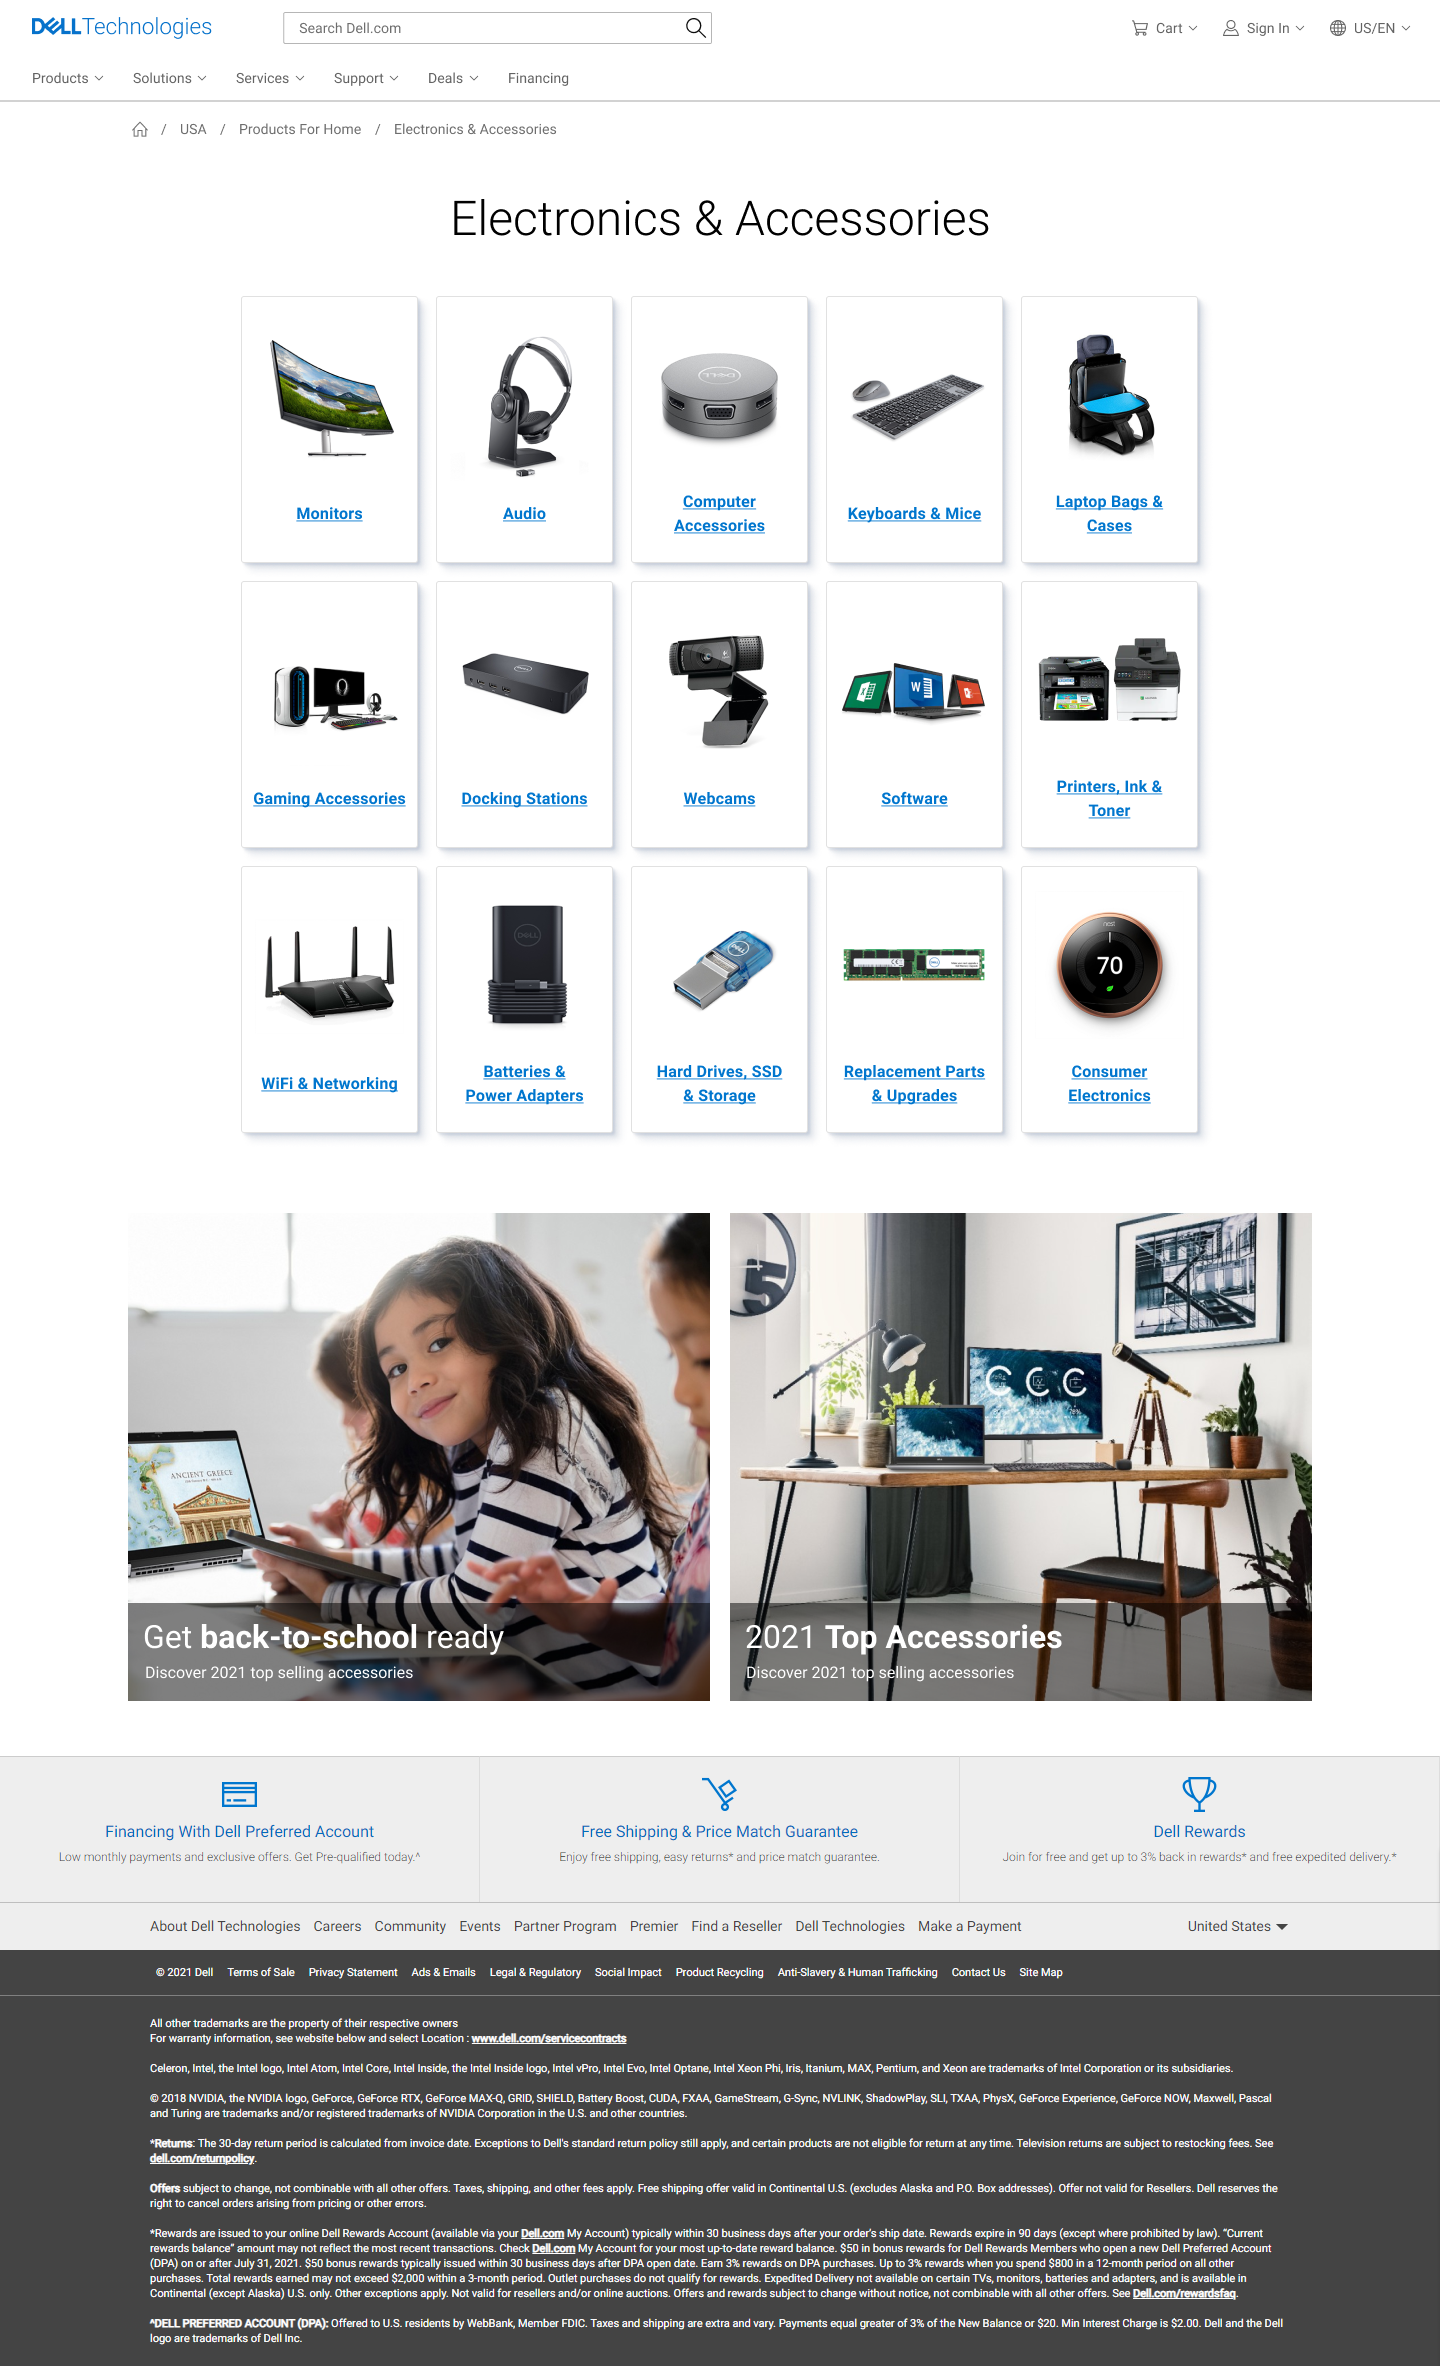
That became the main hypothesis: if shoppers can see and choose their category right away, more of them will engage and go on to buy. Recipe B replaced the text list and product rows with a grid of visual category tiles. Recipe C tested a different tile shape, so we could tell whether the idea worked or just one version of it.
03 · The results
More shoppers engaged, and more of all shoppers converted.
Both redesigns beat the original. Recipe B did best: engagement with the tiles rose almost four points, and effective conversion rose from 6.95% to 7.26%.
The full picture mattered. Among people who engaged, the conversion rate stayed about the same, dipping slightly from 10.09% to 9.97%. The gain came from getting more people to engage in the first place, not from each engaged shopper being more likely to buy. That's a more honest and more useful finding than a single headline number.
| Desktop results | Recipe A (original) | Recipe B | Recipe C |
|---|---|---|---|
| Engaged with tiles | 68.89% | 72.82% | 71.81% |
| Converted after engaging | 10.09% | 9.97% | 9.92% |
| Effective conversion | 6.95% | 7.26% | 7.12% |
04 · Key decisions
Three choices that made the test answer the right question.
Measures first
I defined what "better" meant before any design.
Setting the measures up front took away the option to explain the results after the fact. Whatever the data said, we'd have to take it at face value.
Two variations
I tested two versions of the idea, not one.
With only one redesign, a win could have come from a detail rather than the idea. Recipe C used a different tile shape. When both beat the original, it showed the category-first approach was what worked.
Honest reading
I reported the metric that didn't move, too.
Conversion among engaged shoppers held flat. Showing that next to the gains made the result more credible and pointed to the next question to explore: what happens after someone picks a category.
05 · What I took from this
What structured testing taught me about design decisions.
Measures set before design are worth more than measures picked after.
One tests an idea. The other confirms a decision you've already made.
Setting up a good test is design work.
Choosing the right measures and the right variations takes as much thought as the redesign itself.
Read the whole result, not just the best number.
The metric that stayed flat told us as much as the ones that went up. It's the same habit I bring to AI products now: show people what the data actually says.