Behavioral Correlation · ScienceLogic · Machine learning for IT operations
Making machine learning readable under pressure.
Behavioral Correlation used machine learning to group related events, anomalies, and service relationships, so IT teams could spot problems before users felt them. I led its design from early work through the Colosseum release, while keeping six development teams building toward one experience.
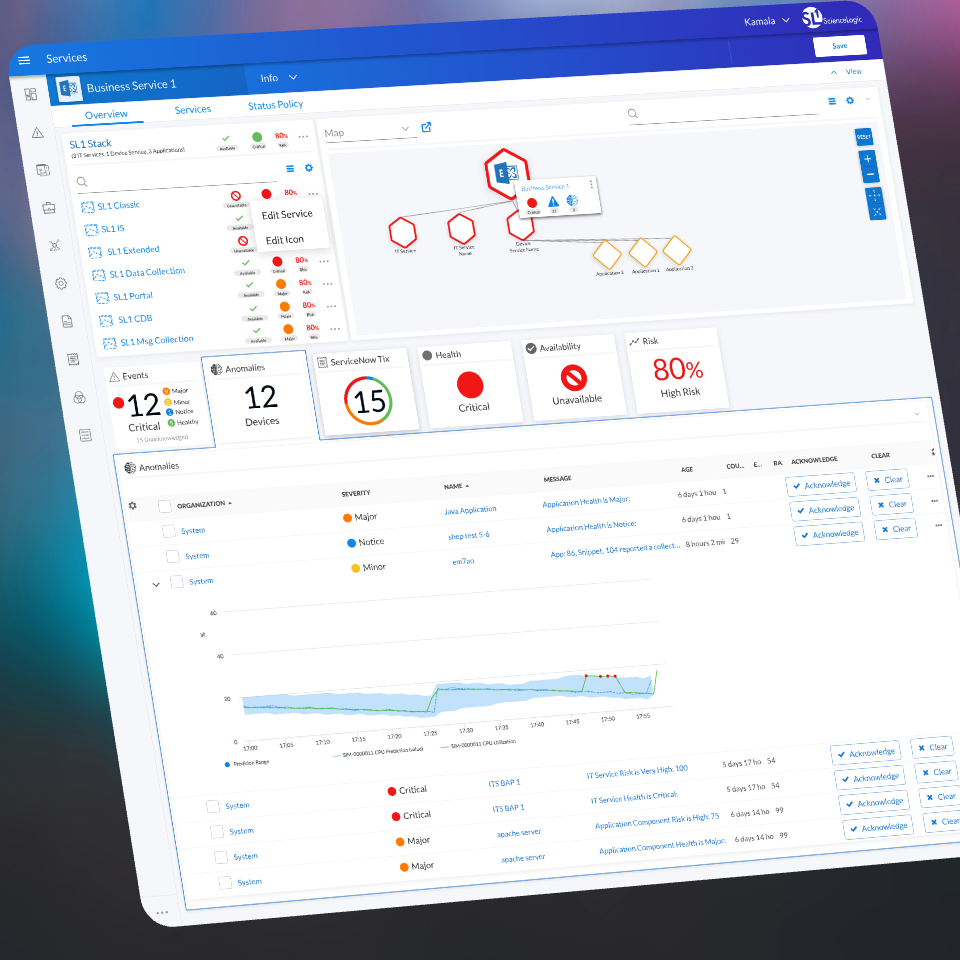
6 dev teams
Building different parts of one feature, each at a different stage, toward one release.
Shipped mid-2020
Released to customers as part of ScienceLogic's SL1 Colosseum release.
"Game-changing"
How ScienceLogic's CEO described it in the launch announcement.
01 · The problem
Thousands of alerts, and very little signal.
IT teams running large, mixed environments were flooded with alerts. Sorting out which ones mattered was close to impossible. Behavioral Correlation used machine learning to find patterns in that noise and group related events into something people could act on.
The design challenge was making that intelligence readable. People working an outage don't have time to learn how a model works. They need to understand what it's telling them, quickly, and trust that it's real.
The model could be as complex as it needed to be. The screen couldn't be.
There was a second problem too. Six development teams were building different parts of the feature at different stages, some ahead, some behind, some changing direction. Keeping the experience consistent while all of that was moving was its own design problem.
02 · The approach
Show the operator's world, not the model's.
I started with how operators already worked: the words they used, how they thought about the services they were responsible for, and what a real problem looked like to them compared with noise.
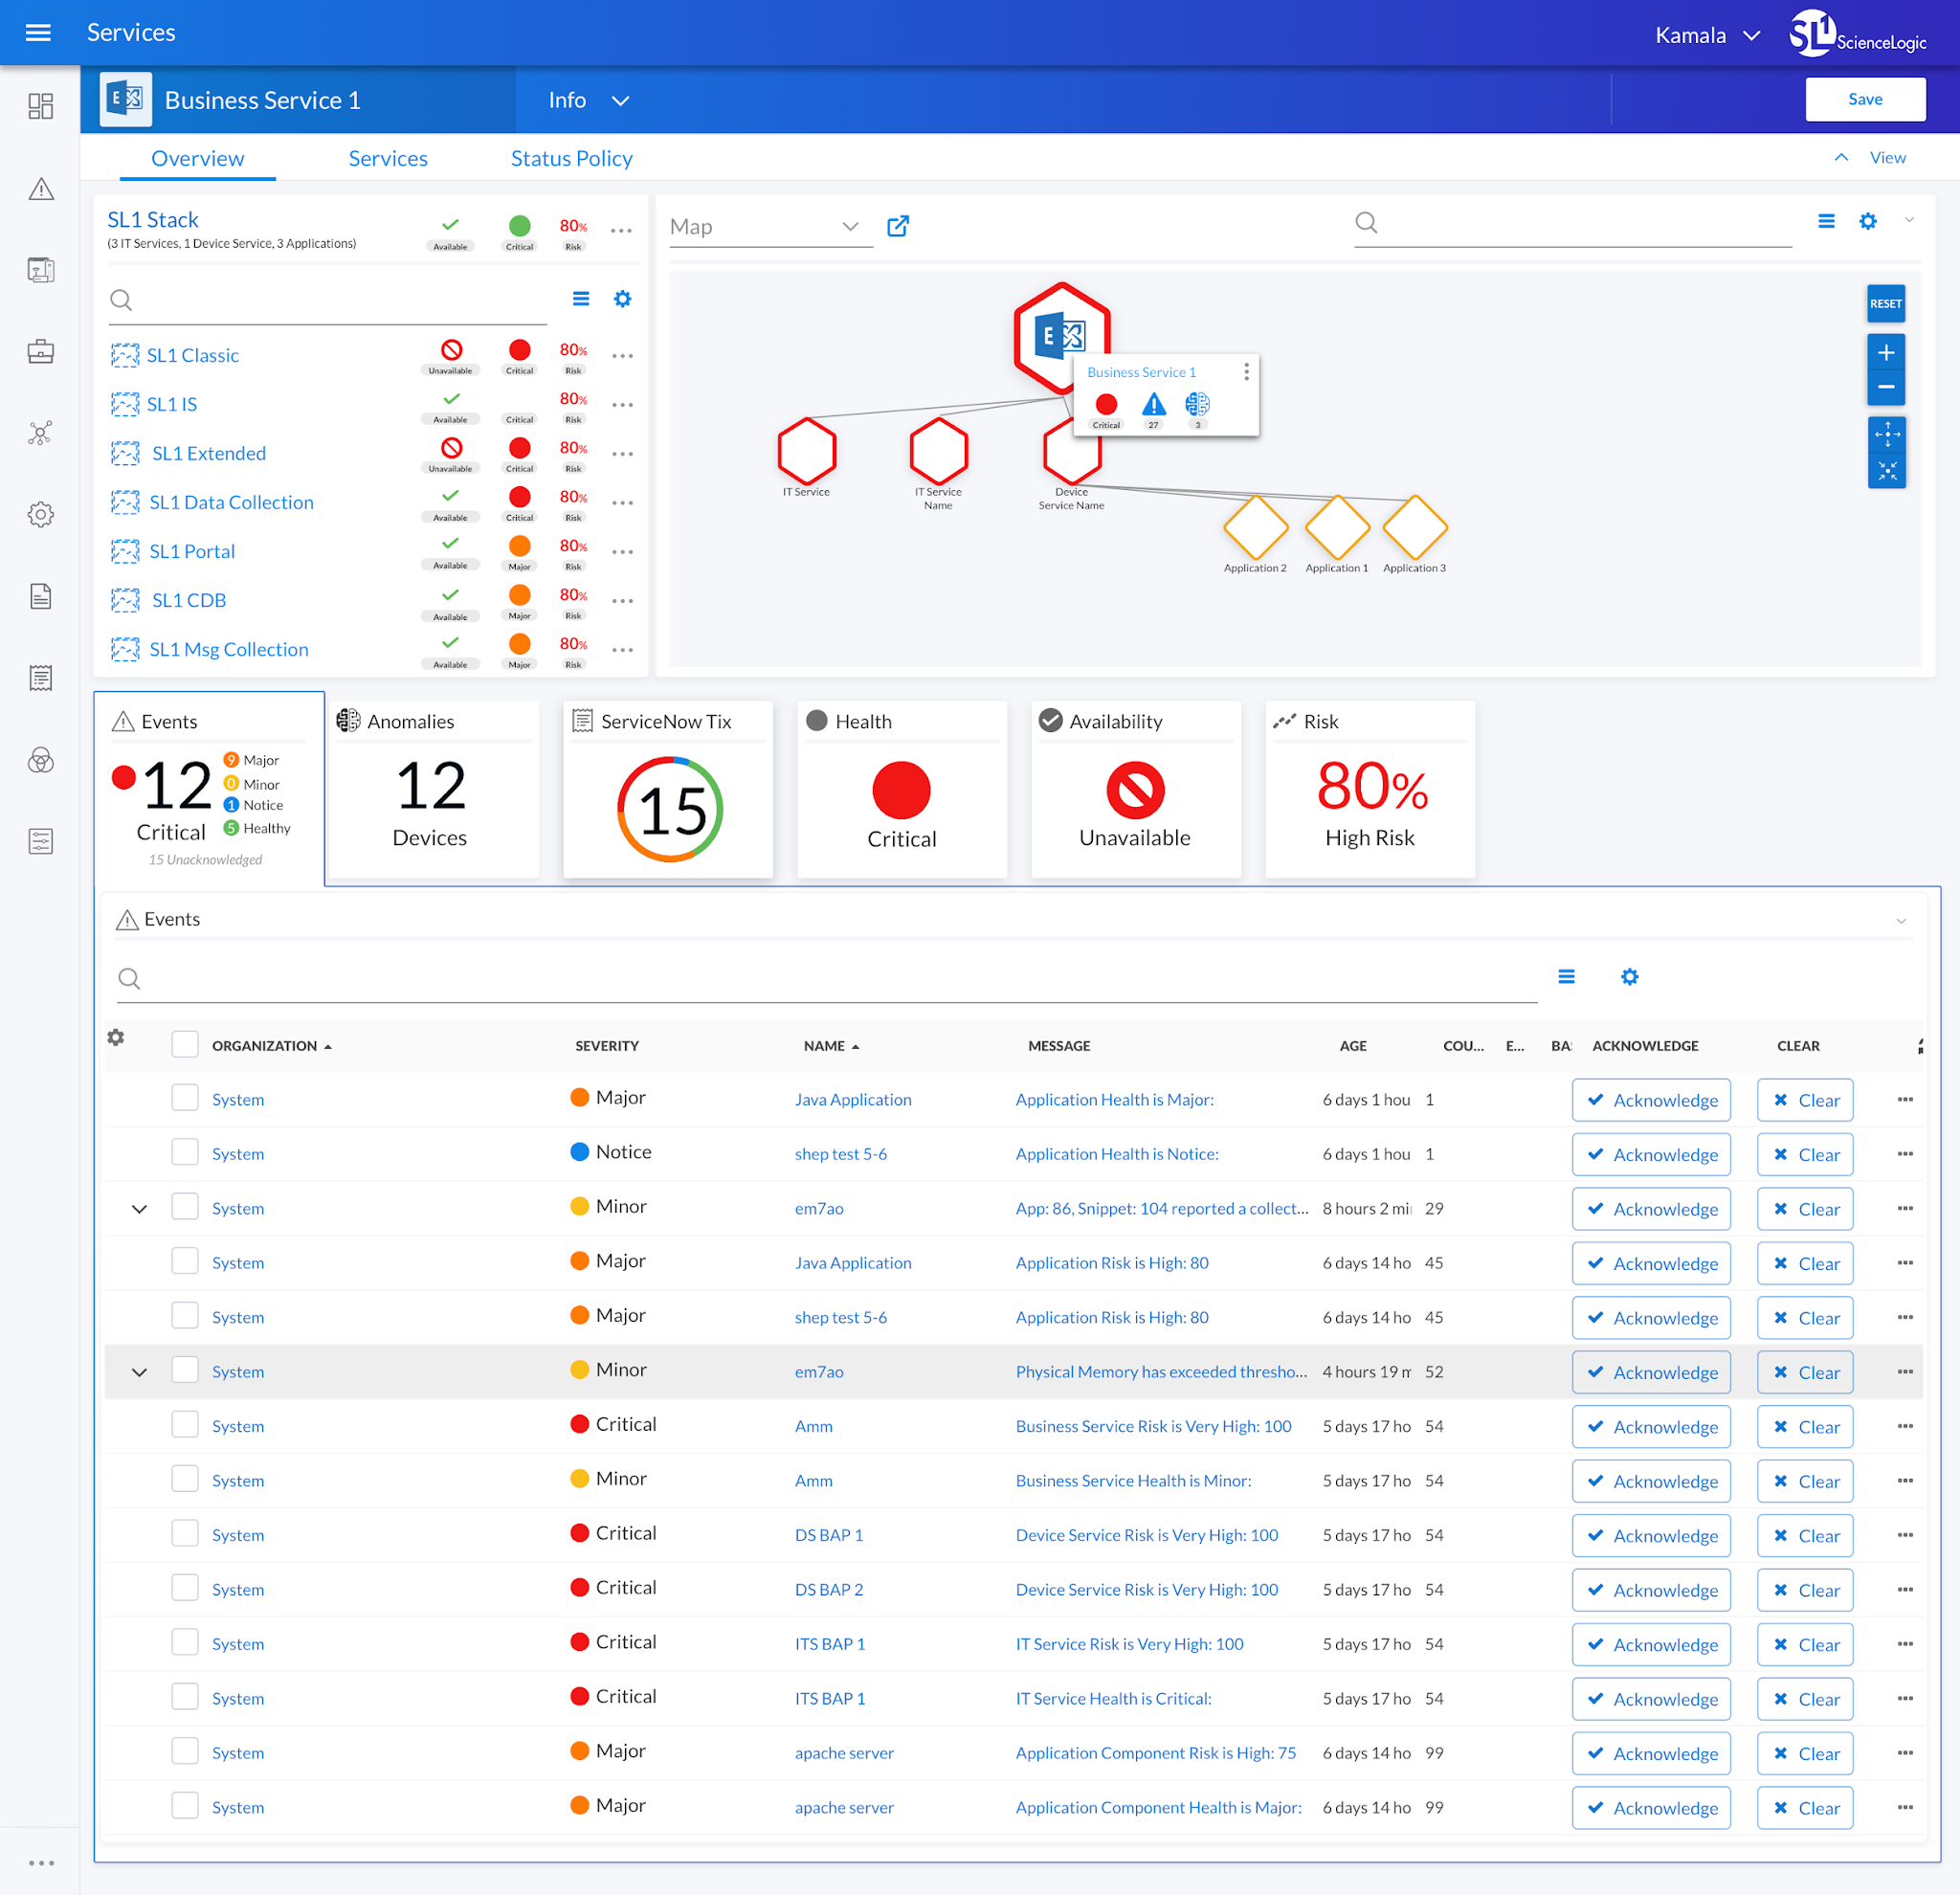
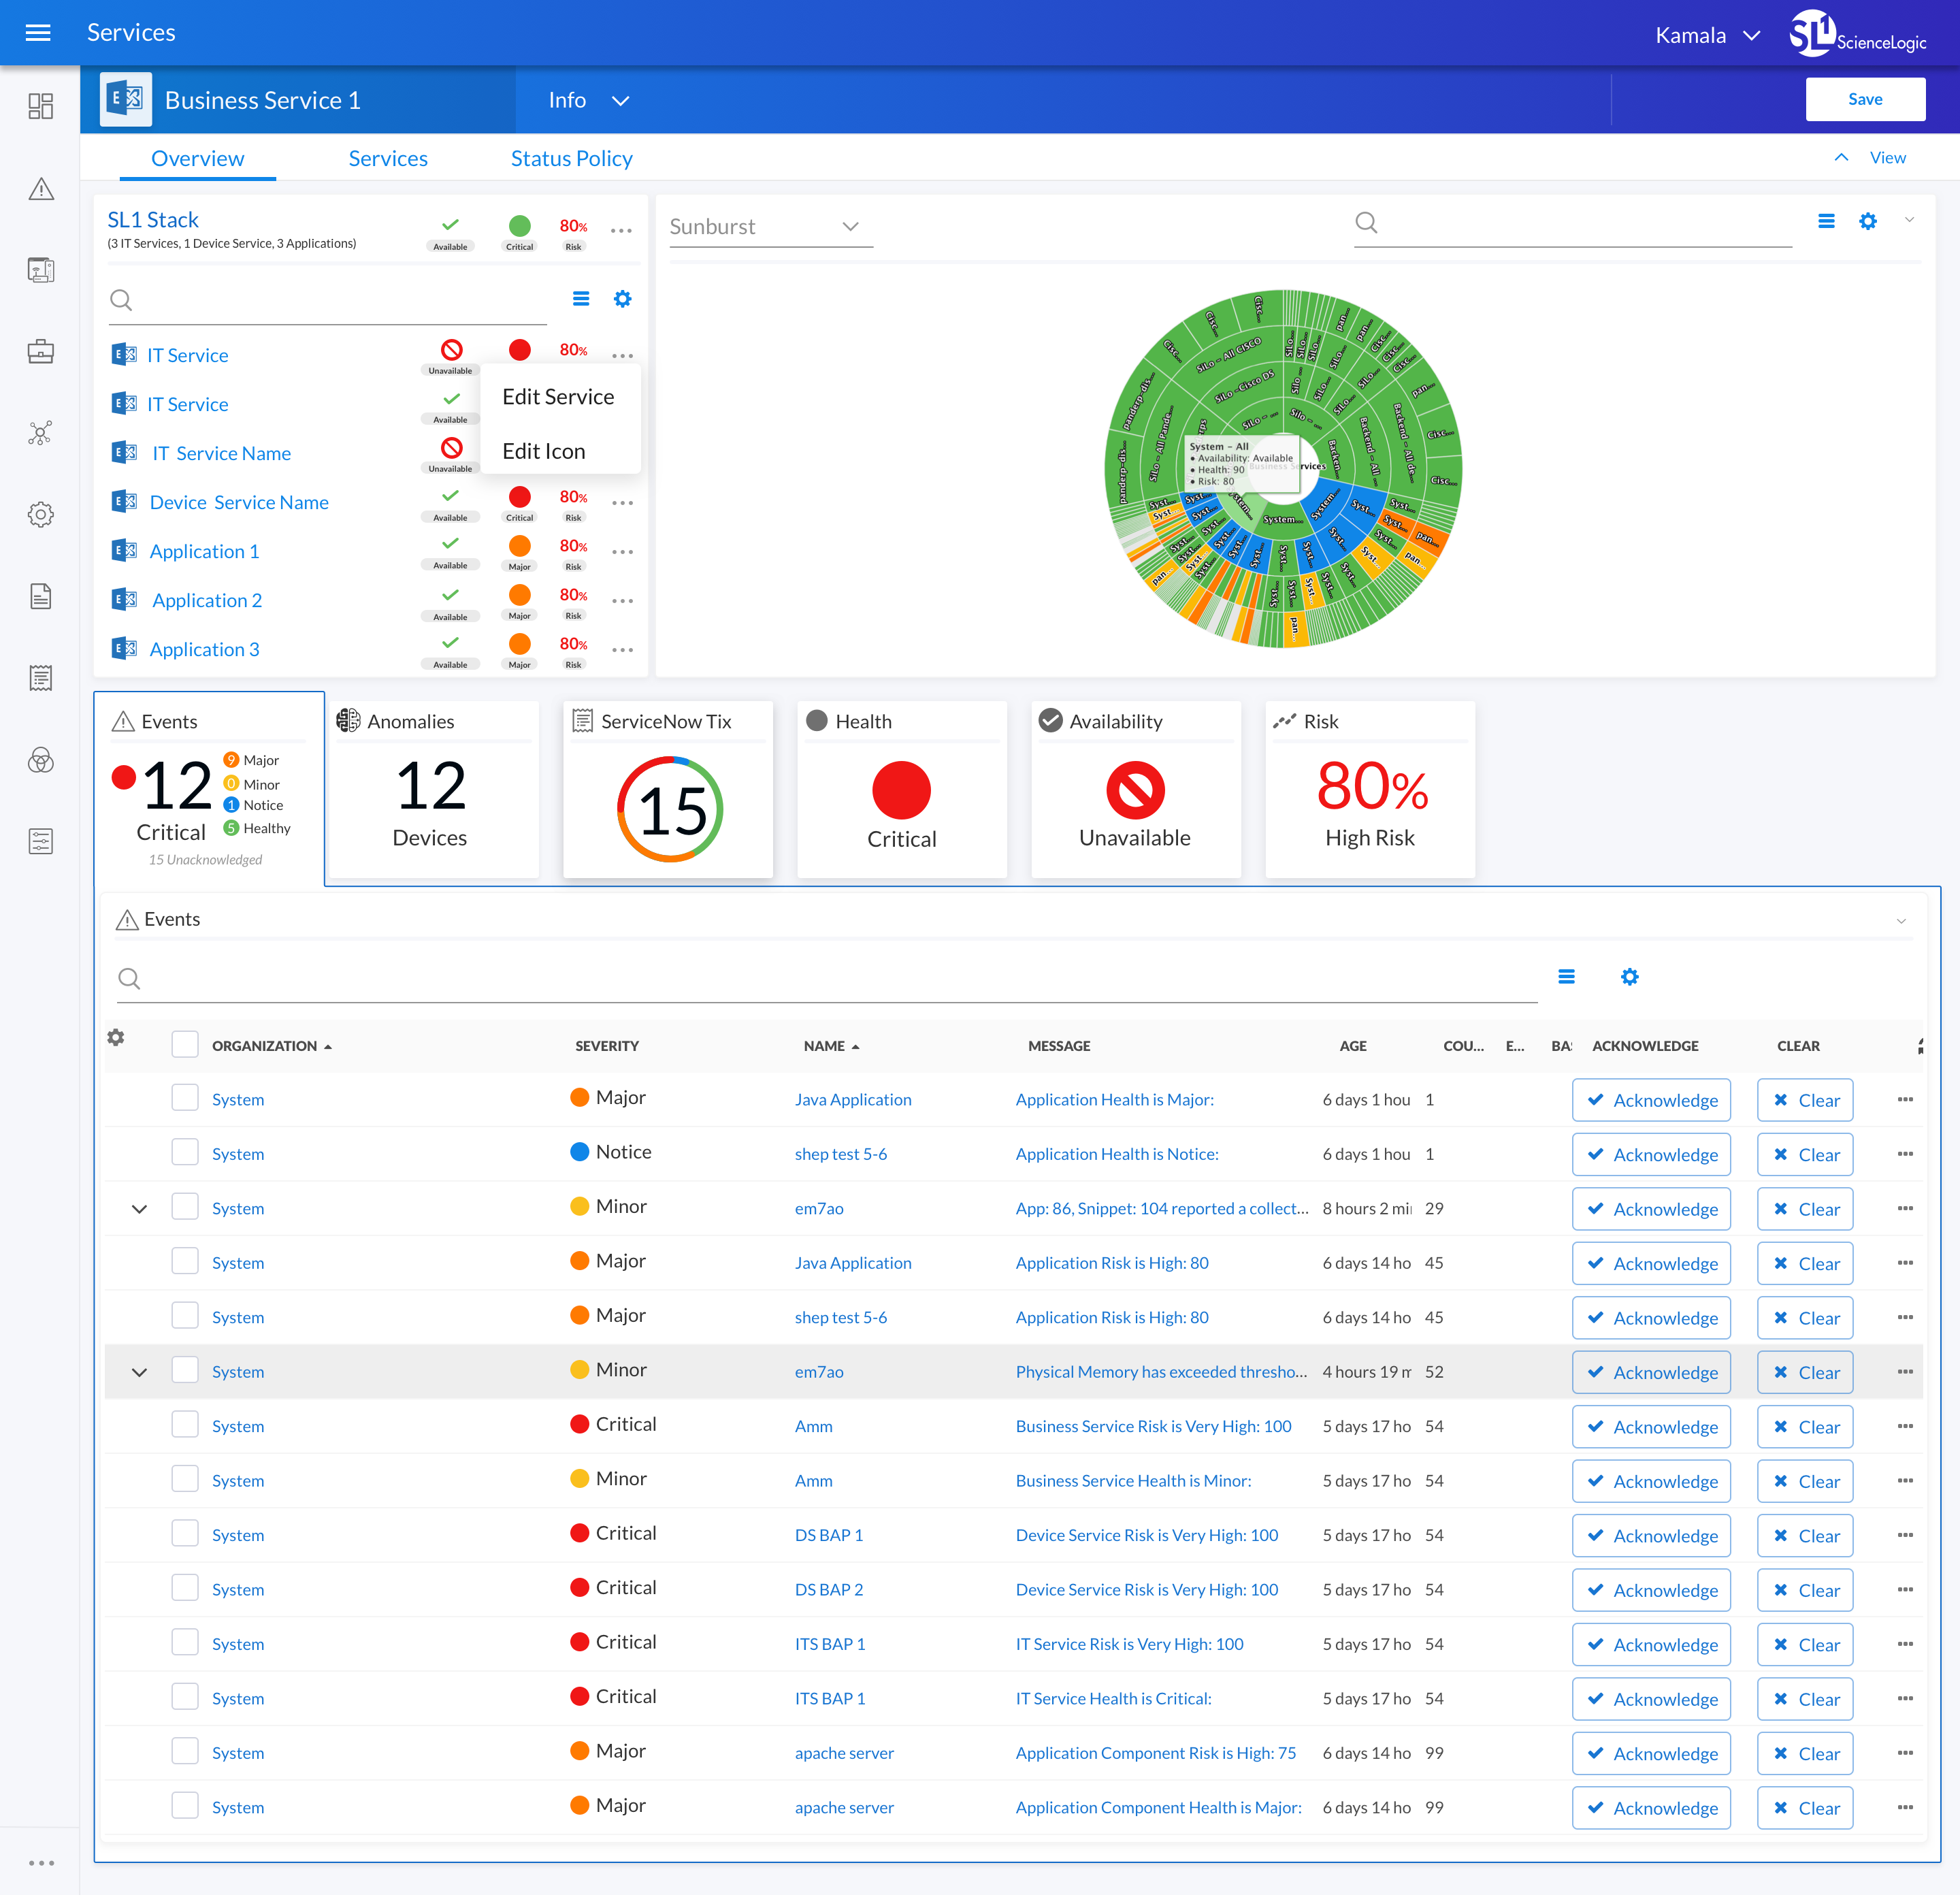
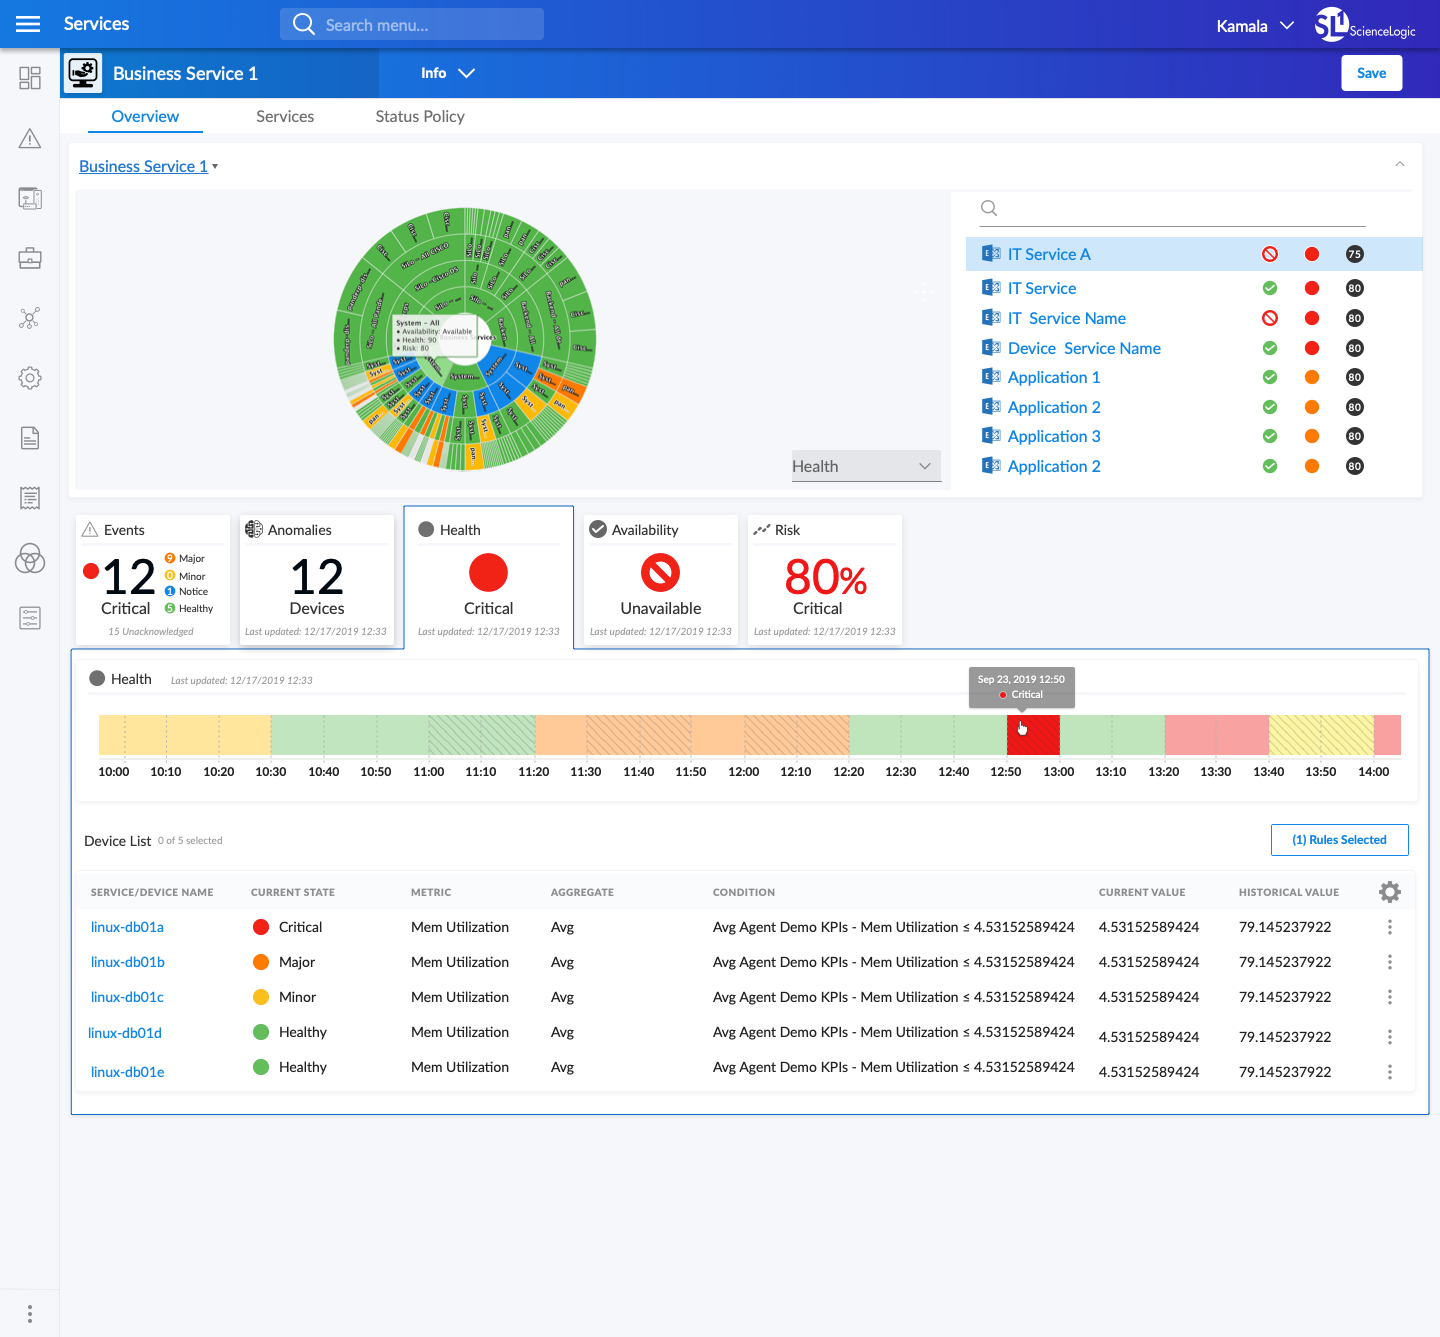
From there, the design put the model's results in those terms. Operators see their business services, how the parts connect, and plain signals like health, availability, and risk. The machine learning shows up as grouped events and anomalies tied to a service, not as model output to interpret.
03 · Key decisions
Three decisions that held the release together.
Mental models
I designed around how operators think, not how the model works.
The model was new and sophisticated. The interface kept that out of the way and showed only what operators needed to get from an alert to an action. Knowing what to leave out meant understanding how operators thought about their environment.
Shared components
I built the design system alongside the feature.
Six teams building on their own would have produced six different versions of the same idea. Building shared components at the same time as the feature made consistency part of the structure, not a cleanup pass at the end.
Design QA
I kept the teams aligned through ongoing reviews, not one kickoff.
Alignment didn't come from a single meeting. It came from regular reviews of each team's work against the design intent. The goal wasn't pixel-perfect sameness. It was an experience that felt like one product, even though six teams built it.
04 · What I took from this
What this taught me about AI and teamwork.
Good AI interfaces show the user's world, not the model.
Operators didn't need to understand behavioral correlation. They needed to understand their services. I still design AI products this way, including NARC at Tidal Cyber.
Coordinating many teams is design work.
Keeping six teams building toward one experience took the same clear thinking as designing the feature itself.
Consistency is cheaper up front.
Fixing consistency after several teams have shipped is much harder, and users can see the gaps.