Coverage Foundations · Tidal Cyber · Systems design
Defining what coverage means, before designing how it looks.
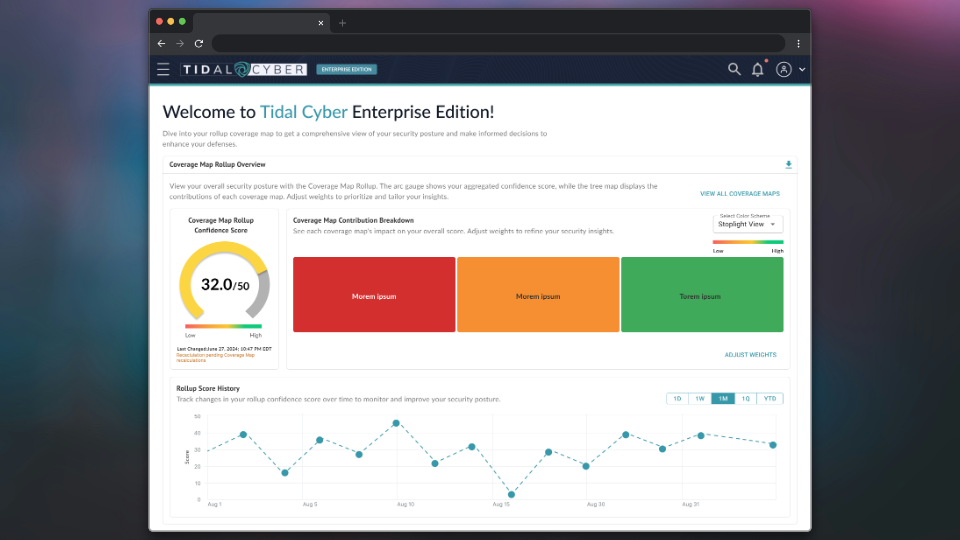
Security coverage showed up in five places across the platform, and each one used its own words and its own math for the same idea. I worked with product and engineering to define one model for coverage, then designed the rollup that gives a security leader one trustworthy score across every coverage map.
5 surfaces, 1 model
Every place coverage appeared now shares the same definitions and scoring rules.
4+ features
Later platform features were built on this model instead of making their own rules.
3 frameworks
CIS Controls, NIST CSF 2.0, and D3FEND each got rules for how, and whether, to show their coverage.
01 · The problem
Every new feature inherited the same unanswered questions.
"Coverage" answers a simple question for a security team: how well are we defended against the threats that matter to us? But the platform had no shared answer to what a coverage score meant. Each place it appeared used different language, different scoring, and different visuals for the same concept.
Every new coverage feature had to make its own decisions about things that should have been decided once. The product felt inconsistent, and the differences grew with each release.
This wasn't a visual design problem. It was a definitions problem.
Redesigning the main coverage view without fixing that first would have been cosmetic. So this work ran alongside, and sometimes ahead of, the redesign that depended on it.
02 · The approach
Audit everything. Define the model. Then design.
I started with an audit of all five places coverage data appeared, including exports, rollups, dashboards, and features still in progress. The goal was to find every inconsistency and trace it back to a definition that was missing or in conflict.
Then I worked with product and engineering to define the core model: what a score means at each level, how scores roll up, how gaps and confidence are shown, and what to do when data is incomplete.
Step 1
Audit five surfaces
Every place coverage appeared, side by side, with each inconsistency traced to its cause.
Step 2
Define the model
What a score means, how it rolls up, and how confidence and gaps are shown.
Step 3
Set the rules
When a visualization should and shouldn't appear, including for each framework.
Step 4
Design on top
The rollup and every later coverage feature built on the same foundation.
03 · Key decisions
The most important outputs weren't screens.
What not to show
I set rules for when a chart shouldn't appear, before designing any charts.
Deciding up front what the system won't show prevents a whole class of problems that would otherwise be caught one at a time, too late, by different people. CIS Controls, NIST CSF 2.0, and D3FEND are each structured differently, with parent and sub-controls, uneven scoring, or categories instead of numbers. One visualization model couldn't represent all three honestly, so each got its own rules.
Weighting
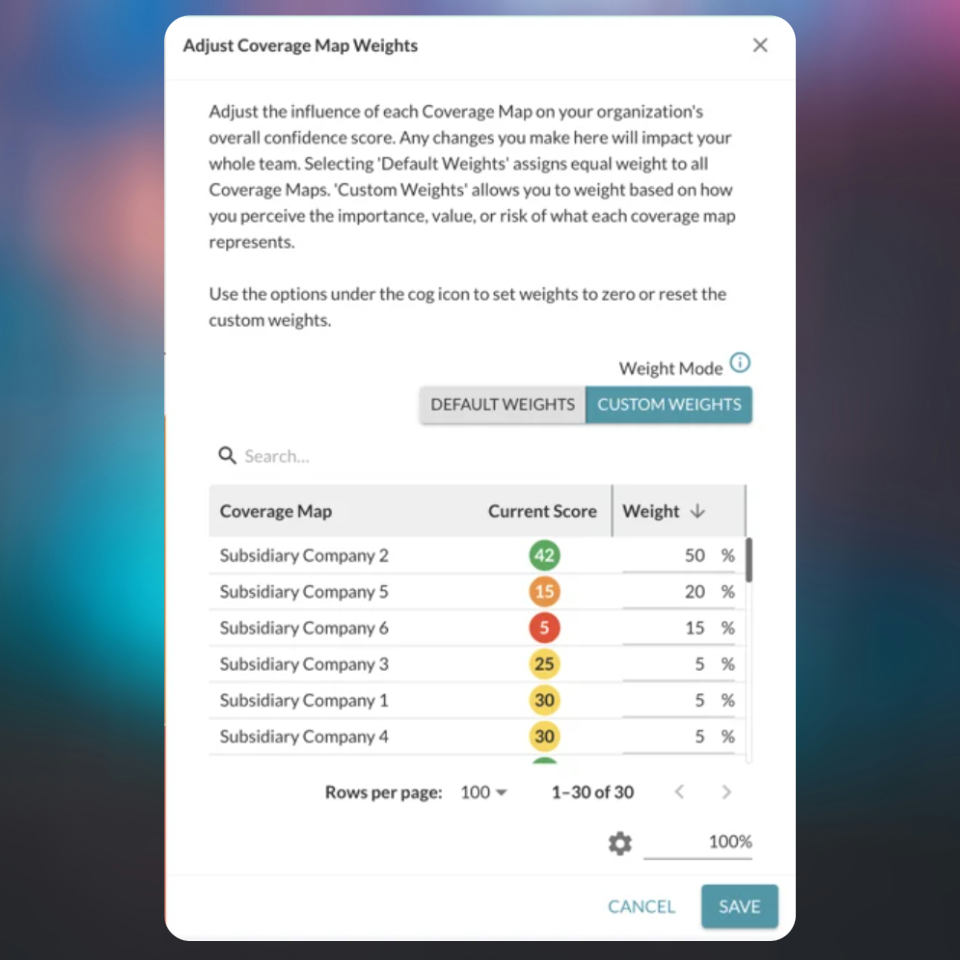
I let teams decide what matters most in their score.
A large company might track coverage for several business units, and they rarely matter equally. By default every coverage map counts the same. Teams can switch to custom weights to reflect the importance or risk of each one, and the dialog says plainly that the change affects the whole team.
Explaining change
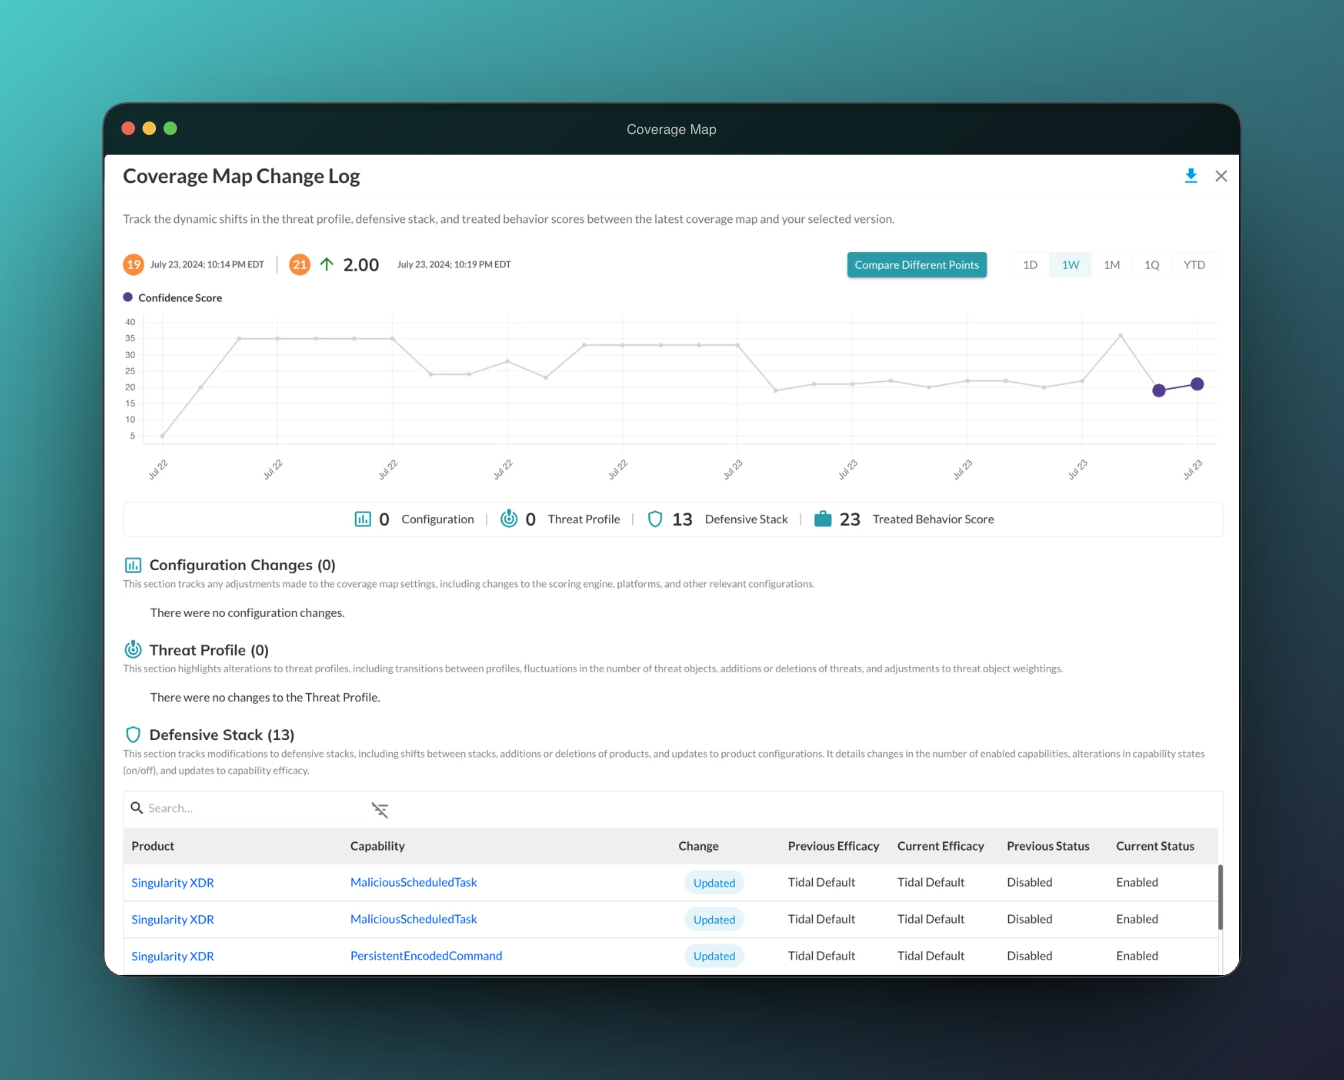
I made every change in the score traceable.
A score that moves without explanation doesn't earn trust. The change log shows what moved the score between two points in time, sorted into configuration, threat profile, defensive stack, and treated behavior changes, down to the individual product capability.
04 · What I took from this
Lessons I've carried into every data product since.
Definitions are design work.
The most lasting thing I made here was an agreement about what the numbers mean. Every screen after it was easier because of it.
Decide what you won't show.
Rules for hiding a misleading chart prevent more problems than any single chart design can fix.
A score needs its story.
People trust a number when they can see why it changed. I brought the same idea to NARC, where every AI suggestion shows where it came from.